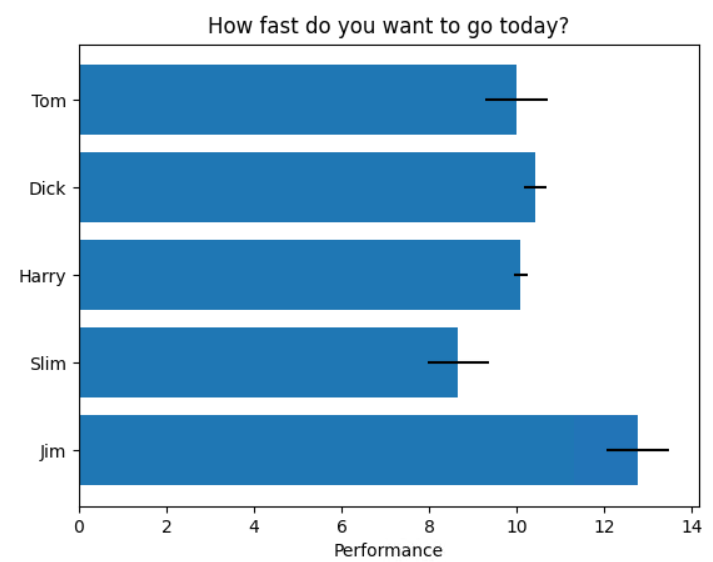
Python水平条形图的画发:
首先我们需要安装
matplotlib 包
matplotlib 是 Python 最著名的绘图库,它提供了一整套和 matlab 相似的命令 API,十分适合交互式地进行制图。而且也可以方便地将它作为绘图控件,嵌入 GUI 应用程序中。
安装的代码:
python -m pip install -U matplotlib
代码
import matplotlib.pyplot as plt
import numpy as np
np.random.seed(19680801)
plt.rcdefaults()
fig, ax = plt.subplots()
# Example data
people = ('Tom', 'Dick', 'Harry', 'Slim', 'Jim')
y_pos = np.arange(len(people))
performance = 3 + 10 * np.random.rand(len(people))
error = np.random.rand(len(people))
ax.barh(y_pos, performance, xerr=error, align='center')
ax.set_yticks(y_pos)
ax.set_yticklabels(people)
ax.invert_yaxis()  # labels read top-to-bottom
ax.set_xlabel('Performance')
ax.set_title('How fast do you want to go today?')
plt.show()
运行的效果 :


 赞
赞


