Python如何绘制雷达图:以及出现问题的解决办法
The number of FixedLocator locations (6), usually from a call to set_ticks, does not match the number of ticklabels (5).
代码如下 :
import numpy as np
import matplotlib.pyplot as plt
# 用于正常显示中文
plt.rcParams['font.sans-serif'] = 'SimHei'
#用于正常显示符号
plt.rcParams['axes.unicode_minus'] = False

# 使用ggplot的绘图风格,这个类似于美化了,可以通过plt.style.available查看可选值,你会发现其它的风格真的丑。。。
plt.style.use('ggplot')

# 构造数据
values = [2.1,2.6,3.4,3.7,5.3]
feature = ['个人能力','QC知识','解决问题能力','服务质量意识','团队精神']

# 设置每个数据点的显示位置,在雷达图上用角度表示
angles=np.linspace(0, 2*np.pi,len(values), endpoint=False)

# 拼接数据首尾,使图形中线条封闭
#只对values,和angles做闭合还是不够 需要再对feature进行闭合
values=np.concatenate((values,[values[0]]))
angles=np.concatenate((angles,[angles[0]]))
feature = np.concatenate((feature,[feature[0]]))
# 绘图
fig=plt.figure()
# 设置为极坐标格式
ax = fig.add_subplot(111, polar=True)
# 绘制折线图
ax.plot(angles, values, 'o-', linewidth=2)
# 填充颜色
ax.fill(angles, values, alpha=0.25)

# 设置图标上的角度划分刻度,为每个数据点处添加标签
ax.set_thetagrids(angles * 180/np.pi, feature)

# 设置雷达图的范围
ax.set_ylim(0,5)
# 添加标题
plt.title('活动前后员工状态表现')
# 添加网格线
ax.grid(True)

plt.show()
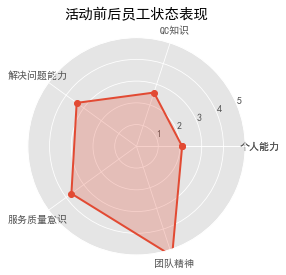
生成的效果图如下:

这里出现的一个坑:
The number of FixedLocator locations (6), usually from a call to set_ticks, does not match the number of ticklabels (5).
这一句报错的中文意思就是:FixedLocator位置(6)的数量 与记号标签(5)的数量不匹配。
出现这个问题怎么处理呢?
#由于我们只对values,和angles做闭合 没有对feature做闭合 然而导致这个问题的发生:
解决代码:
#只对values,和angles做闭合还是不够 需要再对feature进行闭合
values=np.concatenate((values,[values[0]]))
angles=np.concatenate((angles,[angles[0]]))
feature = np.concatenate((feature,[feature[0]]))
总结
感谢各位博友的阅读 ,欢迎您们提出意见 让我们一起交流。感谢你们对CYBLOG的支持理解,本次讲解到此结束!


 赞
赞


